
 EN
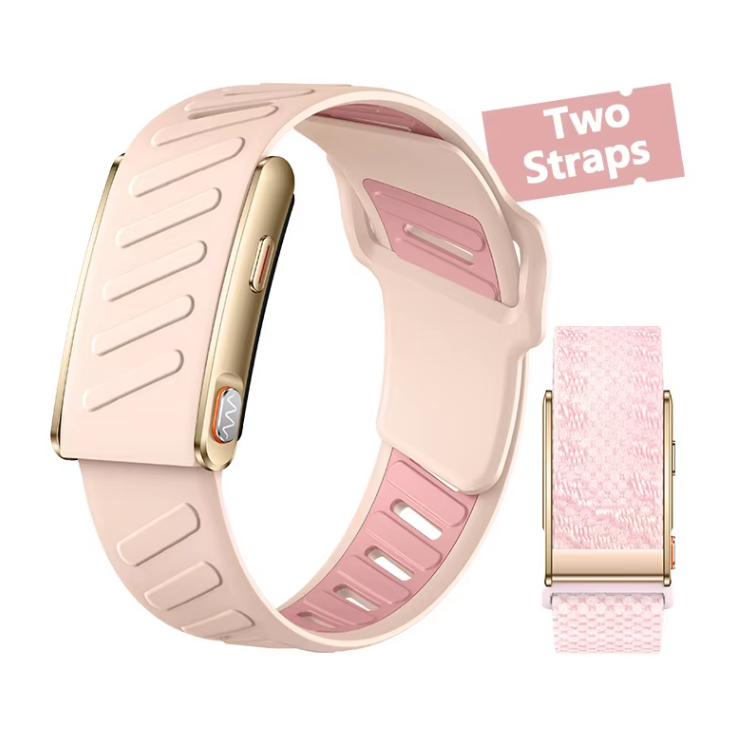
What continuous heart rate data actually captures
A smart watch heart rate feature is often treated as a workout tool, but its real value shows up between sessions. Continuous monitoring samples pulse throughout the day and night, which turns isolated readings into a trend line. That trend line is where useful signals live. A single reading taken at lunch says little. A resting rate that creeps up by five beats per minute over two weeks says something worth noticing. The American Heart Association lists a normal resting heart rate for adults as 60 to 100 beats per minute, and while that range is broad, personal baselines are much tighter. Continuous data makes those baselines visible. It also captures recovery patterns after exercise, sleep, and stressful days, which spot checks miss entirely.
Resting heart rate trends beat single readings
Resting heart rate is one of the clearest recovery markers available on a wrist. It tends to drop with consistent aerobic training and rise with poor sleep, illness, dehydration, or heavy alcohol intake. A smart watch that samples through the night can estimate resting rate more reliably than a manual morning check, because it averages across sleep stages instead of catching one moment. Wearers who track this number for a few weeks often notice patterns that were invisible before. A steady climb across several days can prompt a rest day or a check-in with a doctor. A gradual decline during a training block can confirm that the workload is being absorbed. The key is context. A single elevated morning reading is noise. A sustained shift is signal.
Sleep, stress, and recovery signals that show up over weeks
Heart rate variability, or HRV, is another metric that continuous monitoring makes practical. HRV reflects the balance between sympathetic and parasympathetic nervous system activity, and it is highly individual. A wrist device cannot tell a wearer what a "good" HRV number is. It can show how today compares with a personal range. That comparison is useful for spotting stress accumulation, travel fatigue, or the early stages of illness. Sleep tracking benefits from the same logic. Heart rate tends to fall during deep sleep and rise during REM, so overnight patterns can hint at sleep quality. None of these signals is diagnostic. They are directional cues that help wearers ask better questions. A week of poor sleep and elevated nighttime heart rate is a reasonable prompt to look at evening routines, not a medical conclusion.
| Metric | Spot checks | 24/7 monitoring | Why it matters |
|---|---|---|---|
| Resting heart rate | One morning reading, easily skewed | Overnight average across sleep stages | Shows personal baseline and trends |
| Heart rate variability | Hard to capture without dedicated sessions | Daily comparison against personal range | Hints at stress and recovery load |
| Post-exercise recovery | Missed unless measured manually | Tracks how quickly pulse returns | Useful for training pacing |
| Nighttime heart rate | Usually unavailable | Captures sleep and illness patterns | Supports sleep quality review |
| All-day context | Isolated snapshots | Continuous trend line | Turns numbers into patterns |
Optical sensing limits and when the data gets noisy
Most wrist wearables use photoplethysmography, or PPG, which shines light into the skin and measures how blood volume changes. The technique is convenient and power-efficient, but it is sensitive to motion, skin perfusion, and ambient light. Cold hands, loose straps, tattoos, and rapid wrist movement can all degrade the signal. That is why a smart watch heart rate reading during a hard interval session can lag or spike. Good firmware compensates with accelerometer data and signal-quality checks, but physics still applies. Users should treat workout readings as directional, especially during high-intensity efforts. A chest strap remains more accurate for interval training. The wrist device wins on all-day coverage, not on every single moment.
Battery, fit, and skin tone tradeoffs that affect accuracy
Continuous monitoring has a cost, and battery life is the most obvious one. Sampling heart rate every second drains power faster than sampling every few minutes, so many devices adjust the interval based on activity. That design choice is reasonable, but it means the data is not uniformly dense. Fit matters just as much. A strap that is too loose lets ambient light leak in and reduces contact. A strap that is too tight can restrict blood flow and distort readings. Skin tone also affects optical sensing, because melanin absorbs green light. Sensor designs have improved, but validation studies still show performance gaps across skin tones and activity levels. Honest product teams test across those variables rather than quoting a single accuracy figure.
A field lesson on sensor contact and cold-weather runs
During a pilot build for a fitness brand, the team found that a 1.5 mm gap between the optical sensor and the wrist surface caused missed readings during cold-morning runs. The sensor was fine in the lab. On a moving wrist in low temperatures, peripheral blood flow dropped and the gap let in stray light. The fix came from a revised strap curvature and a softer durometer silicone, not from a new sensor module. That lesson applies broadly. A smart watch heart rate feature is only as good as its mechanical interface with the wrist. Tiny changes in strap geometry, caseback height, and skin contact can matter more than a spec sheet claim. Testing in real conditions, not just on a bench, is what separates reliable data from pretty charts.
For brands building wearable lines around continuous heart rate monitoring, Karen M brings Shenzhen-based manufacturing experience, quality control discipline, and supply chain support that help turn sensor design into a reliable product.
Table of Contents
- What continuous heart rate data actually captures
- Resting heart rate trends beat single readings
- Sleep, stress, and recovery signals that show up over weeks
- Optical sensing limits and when the data gets noisy
- Battery, fit, and skin tone tradeoffs that affect accuracy
- A field lesson on sensor contact and cold-weather runs


